How to Measure Inclusion: the Inclusion Net Promoter Score

Translation of “Come si Misura l’Inclusione. L’inclusion Net Promoter Score” on HBR Italia by Isabella Grandi
Diversity in a company can be a source of creativity, a driver of innovation, and a generator of well-being for employees, along with all the benefits that come with it. However, diversity alone is not enough and can have negative effects if companies do not ensure that people within the organization also feel included. Only by creating an inclusive environment can we truly harness the diversity present in the company and fully leverage its benefits.
The first step toward building more inclusive companies is to measure and monitor how included people feel within the organization. This helps identify areas of intervention and set clear goals, while tracking progress over time. Measuring inclusion provides crucial insights into the impact that a more inclusive work environment can have on all organizational areas, including core business, sustainable development goals, talent acquisition, and retention.

Measuring inclusion presents three significant challenges:
- The perception of inclusion is subjective. It can have different meanings for each individual. When measuring inclusion, it is essential to focus on how people perceive their level of inclusion in that specific context.
- There is a lack of a universally accepted definition of inclusion, making it complex to define which elements should be measured to determine its level within the company.
- The context requires agile and easily implementable tools. While a strong scientific foundation can address the first two challenges, we must also meet the market demand for practical and smart measurement tools.
To address these challenges and measure the impact of our initiatives, we have created a tool to assess employees’ perception of inclusion, combining a solid theoretical foundation with a methodology already used by many companies (the Net Promoter Score). This has led to the creation of the Inclusion Net Promoter Score.
The main advantages of using this tool are its agile implementation and easy interpretation. It is a flexible tool, suitable for frequent use and easily integrated into existing analytical systems within companies.
THE THEORETICAL FRAMEWORK OF REFERENCE
The first step in developing the Inclusion Net Promoter Score, following the scientific approach, was to create a theoretical framework based on existing literature. We identified the Optimal Distinctiveness Theory (Shore et al. 2011) as the reference theory for defining what it means to feel included.
People’s sense of inclusion arises from the fulfillment of both the need for belonging and the need for uniqueness that we all have in relation to a reference group: we feel included in a group when we feel that we are part of it, but at the same time, when we can be ourselves, feeling that our uniqueness is valued.
This personal dimension of the concept of inclusion forms the first pillar of the theoretical framework for the Inclusion Net Promoter Score, which explores how much employees feel they belong to the company and how much they feel valued for their unique characteristics.
In an organizational context, inclusion—and thus the fulfillment of these needs—manifests through various elements, such as access to information, participation in decision-making processes, and fair treatment. To streamline the process and avoid creating overly lengthy measurement tools, we identified the most indicative factors of an inclusive environment.
To do this, we integrated our theoretical framework with the findings of the research “Valuing Differences in the Workplace,” conducted by MIDA in collaboration with the Università Cattolica del Sacro Cuore, which analyzes the results of a questionnaire administered to more than 3,000 employees within Italian companies.
The study identified the organizational factors most strongly correlated with an inclusive culture:
- Psychological safety: how secure people feel within teams when expressing problems and difficulties;
- Development opportunities: how much individuals are able to adapt their career path and professional experience to their personal needs;
- Conflict culture: the extent to which it is possible to engage in constructive discussions when there are disagreements;
- Contribution to decision making: how much individuals are able to contribute to decision-making processes;
- Fairness: whether rules are applied equitably.
The more inclusive a company is, the more employees will experience psychological safety, perceive adaptable development opportunities, be able to engage in constructive discussions with colleagues, feel part of the decision-making processes, and perceive they are being treated fairly.
These elements form the second pillar of the framework for the Inclusion Net Promoter Score and determine the organizational dimension of the tool (see figure).

Source: MIDA
A SIMPLE AND EFFECTIVE METHODOLOGY
Questionnaires are the most common way to analyze people’s perceptions, and with more time and resources available, they would also be the best choice for measuring inclusion. However, it is impractical to ask companies to administer lengthy questionnaires to their employees, probing how included they feel with multiple questions.
Given this market need and the existing experience of many companies already using this methodology, we identified the Net Promoter Score as the investigative tool on which to model the theoretical framework we created. In 2003, Frederick F. Reichheld published an article in Harvard Business Review titled “The One Number You Need to Grow,” where he introduced a new tool to measure customer satisfaction and loyalty towards companies, called the Net Promoter Score (NPS).
The NPS consists of asking customers: “How likely are you to recommend our company to a friend or colleague?” Respondents choose a score from 0 to 10, and based on their response, they are grouped into three categories:
- Promoters: those who are extremely likely to recommend the company and have given a score of 9 or 10;
- Passives: those who respond with a 7 or 8;
- Detractors: those who are not at all likely to recommend the company and therefore have given a score between 0 and 6.
The NPS is calculated by subtracting the percentage of detractors (total detractors over total respondents) from the percentage of promoters (total promoters over total respondents). It can be expressed as a percentage or as a number if multiplied by 100 (see figure).
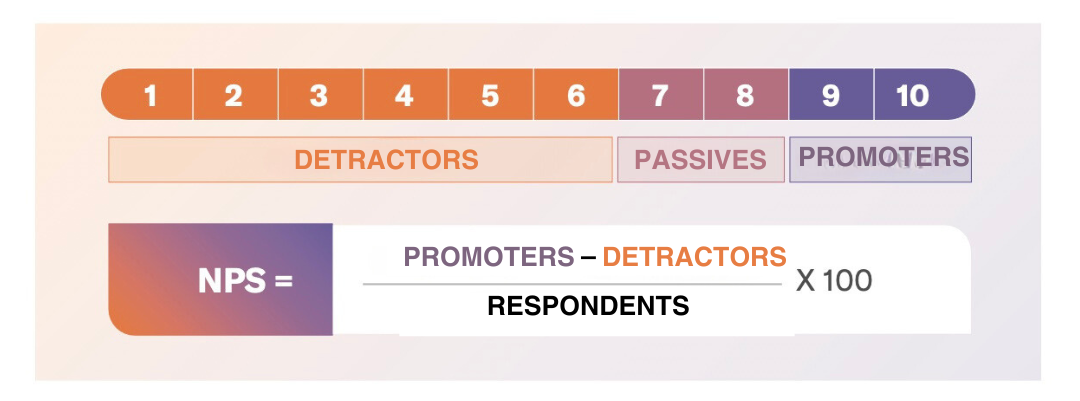
Source: Adapted from Reichheld, 2003
As a result, the NPS can range from -100 to +100, where:
- An NPS of -100 indicates that there are no promoters
- An NPS above 50 is a good score
- An NPS above 75 is an excellent score and above average
- An NPS of +100 indicates that all respondents are promoters
Even though the NPS has gained popularity over the years and is widely used, especially in the retail sector, there are some common criticisms and concerns associated with it. In particular, the claim that NPS is the number that can predict company growth has been challenged (Grisaffe, 2007; Kristensen & Eskildsen, 2012; Zaki et al., 2016; Fisher, 2018).
Clearly, no single indicator can be completely reliable, regardless of the phenomenon being measured, and further investigation is needed to identify the causes of a specific result. Grisaffe compares NPS to a dashboard light that “is valuable and reveals important information about the car’s performance” (Grisaffe, 2007, p. 50), but which then requires a diagnosis of the root cause: “So NPS could be a valuable diagnostic metric. But by itself, alone, it’s probably not the only thing a company needs to succeed” (Grisaffe, 2007, pp. 50).
In any case, the benefits of NPS have outweighed its potential drawbacks, given its widespread use beyond the retail sector and its focus on customer loyalty. It has been adapted to the corporate context to gather insights on employee engagement and commitment, leading to the creation of the employee Net Promoter Score (eNPS).
The mechanism is exactly the same as NPS, but the question pertains to how likely employees are to recommend their employer, asking: “How likely are you to recommend your company to friends and family?”
Respondents are grouped into promoters, passives, and detractors based on the same scoring categories, which in this case represent different levels of engagement and commitment to their company. Kaufman et al. (2013) provide the following definitions for the three categories:
- Detractors (0-6): dissatisfied employees who speak negatively about their company
- Passives (7-8): relatively satisfied employees, but not loyal. They are likely to accept another offer if it comes along. They talk about their company only in neutral terms
- Promoters (9-10): loyal employees who go out of their way to help their colleagues. They speak positively about their company and are enthusiastic about it
THE INCLUSION NET PROMOTER SCORE
By combining the theoretical framework and the Net Promoter Score methodology, we once again turned to the literature to specify the questions for each of the identified organizational dimensions.
Each question follows the ‘classic’ NPS format, specifying the element to be considered. For example, to explore the dimension of psychological safety, the question asks: “How likely are you to recommend your company in terms of… being able to express problems and difficulties?” Additionally, a general question was added to the questionnaire to assess the overall perception of inclusion, producing a global indicator of the company’s inclusivity level.
The distinct aspect of this opening question is the perspective it specifies. It asks how likely people are to recommend their company to ‘underrepresented’ groups—those groups of people most likely to experience exclusion, such as women, people with disabilities, members of the LGBTQ+ community, etc.
The Inclusion Net Promoter Score consists of 8 questions, and the score for each is calculated following the methodology described above: the higher the score, the more included employees feel within their company, both generally and in relation to specific organizational dimensions. The benefit is not only gaining an overview of how inclusive the company is, but also identifying specific areas for intervention.
INCLUSION NET PROMOTER SCORE IN ACTION
In November 2022, we initiated a project with an Italian company operating in the energy sector. At that time, the company had about 4,500 employees, located in units and offices across Italy. Among the many existing cultural transformation initiatives, the HR division wanted to start a change process to build a more inclusive company.
In the first phase of context analysis, the Inclusion NPS was administered to assess employees’ perceptions of the company’s inclusivity and to provide a clear snapshot of the starting point. Focus groups were then organized to delve deeper into the NPS results, and an organizational analysis of processes, policies, and company practices was conducted to determine their level of maturity regarding inclusion.
The implementation of the Inclusion NPS yielded positive results, both in terms of the project’s goal, providing an accurate, data-driven starting point, and the tool’s application. The Inclusion NPS helped identify very specific areas for intervention, thanks to the analysis of results not only at a general level but also regarding specific respondent characteristics such as gender, age, company seniority, etc.
The collected scores were positive, indicating that people within the company generally have positive experiences regarding feeling included, with an overall Inclusion NPS score of 54 on the general question. Scores on organizational dimensions, though lower, remained positive (around 30), still indicating a higher presence of promoters compared to detractors.
The lowest scores were recorded in the areas of fairness, belonging, and decision-making. This could be due to the company’s highly hierarchical nature, where people, especially those working in regions far from the headquarters, feel they cannot influence decisions made at the corporate level and feel distant from the “heart” of the company itself. From the analysis of results concerning specific groups, it emerged that Inclusion NPS scores tend to increase with managerial responsibility, job level, and proximity to headquarters.
These findings align with the literature on factors that most influence the perception of inclusion within companies. The same issues were noted during the focus groups and confirmed by the organizational analysis of processes. For example, the hierarchical nature of the company was highlighted as a key area of concern in all focus groups, contributing to a lack of transparency (which can consequently affect the perception of fairness) and the difficulty in influencing decisions.
The project allowed us to assess the effectiveness of the Inclusion Net Promoter Score as a method for measuring the perception of inclusion in the company under two main aspects:
- Coherence with the literature. The results from the analysis align with the factors that are positively or negatively correlated with people’s perception of inclusion in the company
- The high response rate (nearly 70%, with peaks of over 85% in some business units) provides direct feedback on its ease of implementation and understanding
At the end of the first phase of the project, through several interviews, we gathered feedback from the HR team and the company’s D&I specialist on the use of the Inclusion NPS, highlighting two main aspects:
- Familiarity with an already known methodology: the company had been using the NPS methodology since 2019 for employee engagement topics, typically administering 3 surveys per year. Before the first administration, a significant effort was made to disseminate information, explaining how it works, the data collection process, and the use of the results. For this reason, even though the questions used for the Inclusion NPS were new, the company’s employees were already familiar with the format, leading to a high response rate consistent with previous NPS surveys
- Speed, simplicity, and accessibility: the time required to complete the 8 total questions of the Inclusion NPS is very short. The questions only require a response indicating a number from 0 to 10, and their wording is clear and concise, making them easy to understand. The online administration, in this case through Google Forms, also makes the tool easily accessible across multiple devices.
An additional benefit of this process, which received particularly positive feedback, is the ease with which the collected results can be communicated, both to the Leadership Team and the company’s employees, thanks to the simplicity that characterizes the NPS. The scores are intuitive to interpret, and it is easy to immediately identify areas for improvement to explore further.
BEST PRACTICES FOR APPLYING THE INCLUSION NPS
The Inclusion NPS has proven to be a tool that is easy to implement, with a strong theoretical foundation that allows for the concise and agile measurement of how included employees feel within companies. The Inclusion NPS can be administered frequently to measure inclusion in the company and monitor its progress, or one (or all) of the questions can be integrated into NPS tools already in use by the company, avoiding overburdening employees and depending on the specific focus of the organization.
As with any phenomenon, relying on a single indicator to measure inclusion may be limiting. However, the Inclusion NPS proves to be a valuable measurement tool, especially when used alongside other methodologies, as illustrated by the case study presented.
When implementing the Inclusion NPS, as with any other measurement methodology, we have identified three tips to keep in mind to ensure the tool’s effectiveness:
- Regularity: The Inclusion NPS should be implemented regularly, not as a one-time intervention. The tool we’ve developed allows for frequent data collection, enabling the company to measure, for example, the impact of interventions aimed at increasing inclusivity
- Transparency: It is essential to clarify why the questionnaire is being requested (as well as participation in any focus groups, etc.). Communicating clearly from the outset how the information will be used and maintaining the commitment is crucial to ensuring continuous engagement and avoiding unmet expectations. This is even more important when dealing with sensitive topics like inclusion. Furthermore, if employees believe that the organization will act on the feedback received, they will be more inclined to share their true opinions. Considering this point, the response rate to such surveys can already be considered an indicator of the organization’s level of inclusivity, as it signals the extent to which employees experience psychological safety
- Diversity: A high level of inclusion might be detected in a homogeneous environment where there is a strong majority, for example, of men, white people, and a certain age group. For this reason, it is important to analyze the collected information by segmenting the data based on characteristics such as gender, age, job level, etc. This type of analysis can highlight whether groups that are typically at risk of discrimination are underrepresented in the sample and/or feel less included than the majority groups present in the company